
by: SEO Strategist
Ashot Nanayan
Updated January 10, 2026
4 min. read
WhatsApp
 (+1) 818 355 1889
WhatsApp
(+1) 818 355 1889
WhatsApp
(+1) 818 355 1889
WhatsApp
(+1) 818 355 1889
WhatsApp
(+1) 818 355 1889
The SEO industry has changed dramatically over the past few years, but 2025 feels different. Search isn’t just about rankings anymore; it’s about visibility across platforms, AI results, and user intent that shifts faster than ever.
I wanted to see which search engines, geographic markets, and platforms dominate the SEO market today, so I manually collected and verified the latest numbers myself.
In this post, I’ll share the most accurate, up-to-date SEO market share statistics you’ll find anywhere, plus a few patterns I noticed while comparing data across years. Whether you’re an SEO professional or a business owner, this will give you a realistic look at where the SEO world stands in 2025.
If you’re looking for a results-driven SEO agency that understands how real data translates into growth, we’d love to work with you.
Across sectors, organic search drives ~53.3% of trackable web traffic, still the largest channel.
In Conductor’s study of education, finance, healthcare, professional services, retail, technology, and travel, organic averages 33% of total traffic across these industries.
News & media: after AI Overviews rolled out, some major publishers saw organic traffic plunge up to ~40% YoY. Wall Street Journal
News & media: Similarweb reports news referrals fell from >2.3B (mid-2024) to <1.7B (May 2025), while zero-click share rose from 56% → 69%. New York Post+1
Local/Restaurants: enterprise brands saw –35% YoY local impressions in Q2 2025.
Also consider: 200+ Link-Building Statistics

Local/Financial services: –21.3% YoY local impressions in Q2 2025.
Local/Business services: –30.2% YoY local impressions in Q2 2025.
Retail: 53% of shoppers always research before they buy.
Retail (APAC): 67% of Aussies say making the right purchase takes more effort now, so they do more research.
Retail: 81% of shoppers research online before buying.

Travel (UK): 57% rely on search engines to research travel.
Healthcare: 88% of consumers start provider discovery on Google.
B2B: 61% of buyers prefer a rep-free, research-led buying experience; 73% avoid irrelevant outreach.
Ecommerce: visits from ChatGPT convert at 11.4% vs. 5.3% for organic search; organic remains the baseline comparator for store conversions.
Local search overall: searches for places without “near me” grew 150%, showing default local intent across categories like food and services.
Channel mix today: AI search is growing, yet <1% of referral traffic; organic still dominates.
Also consider: 100+ AI SEO Statistics
Worldwide search share: Google holds about 90.4%, followed by Bing at 4.1%, Yandex at 1.7%, Yahoo at 1.5%, DuckDuckGo at 0.9%, and Baidu at 0.8%.
On desktop worldwide, Google maintains a roughly 82% share, with Bing at about 10%.
Across Europe, Google controls nearly 89% of the market, while Bing and Yandex share the remaining single digits.
On desktop in Europe, Google still leads with more than 77% share.
In the United Kingdom, Google holds about 93% market share overall, with Bing close to 5%.
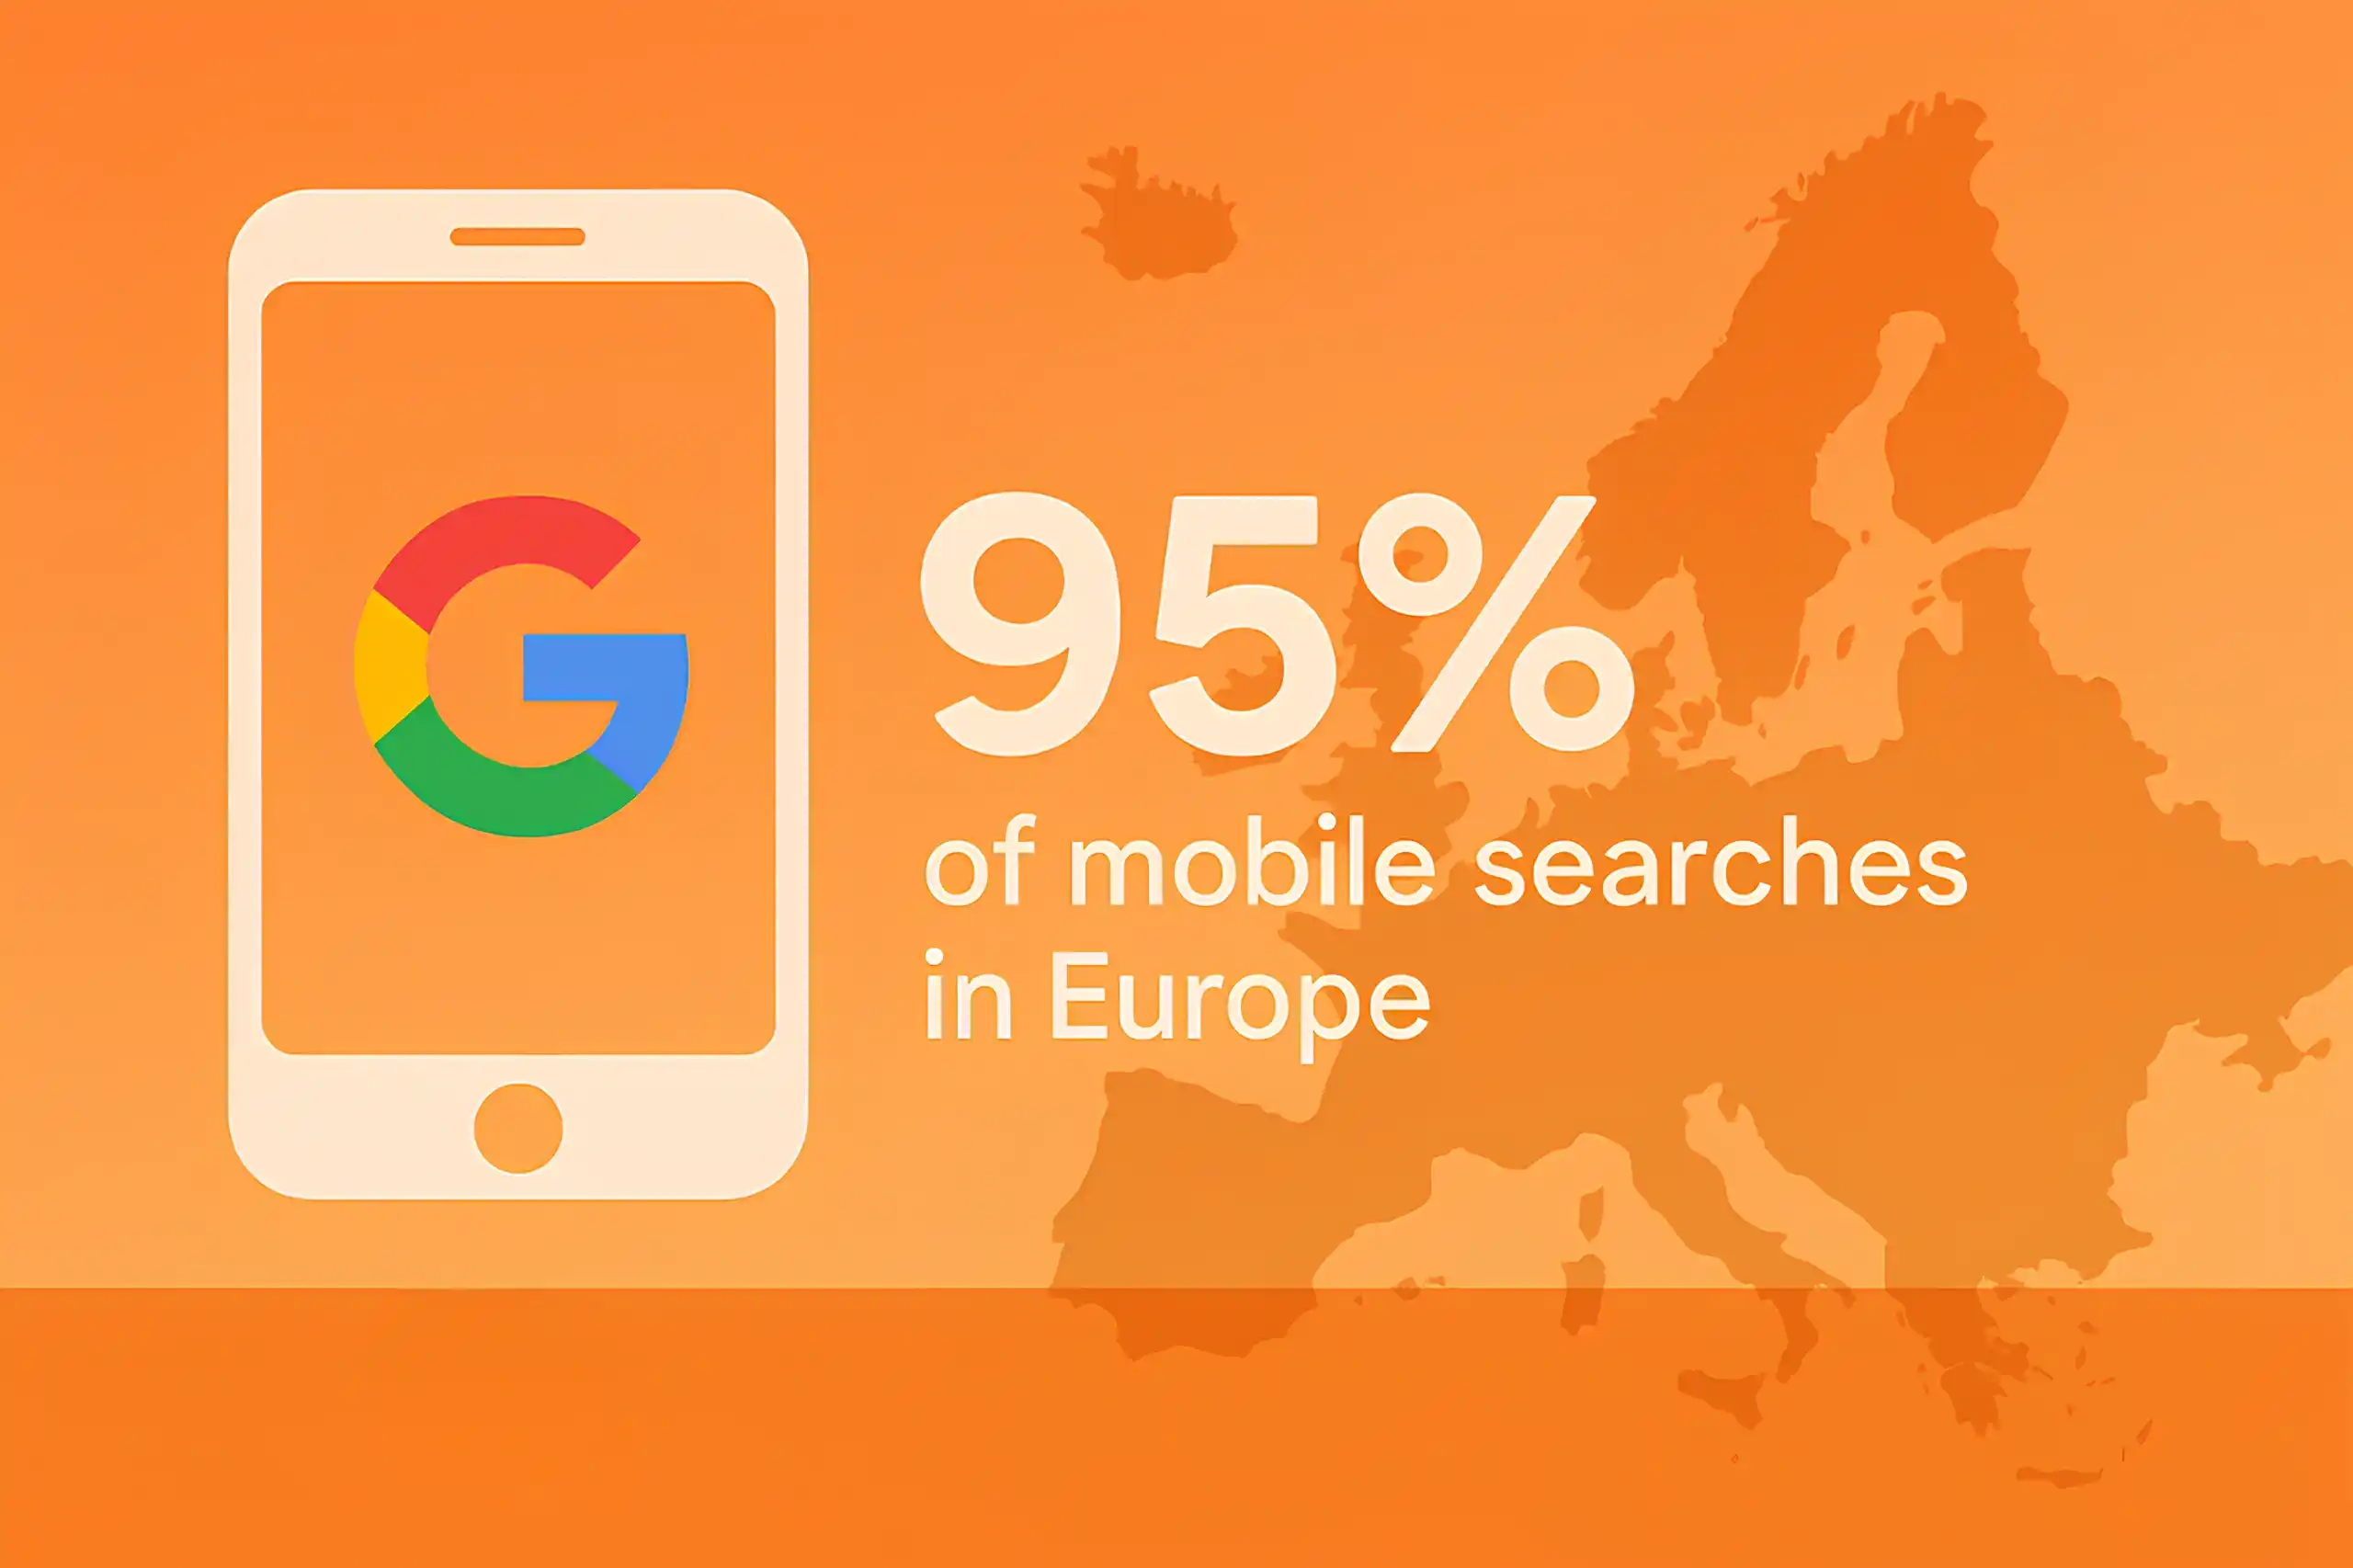
On mobile in Europe, Google dominates with almost 95% of searches.
On desktop in the UK, Bing performs slightly better, securing over 13% share.
Mobile searches in the UK are heavily dominated by Google, reaching nearly 97%.
In the United States, Google’s share remains around 85%, followed by Bing at 8%, Yahoo at 3%, and DuckDuckGo near 2%.
On U.S. mobile devices, Google captures roughly 93% of all searches.
In India, Google commands almost 98% of the search market, leaving only a fraction to Bing.
Mobile usage in India is nearly monopolized by Google, crossing 99%.
On desktops in India, Google’s market share stands at around 94%.
In Japan, Google handles roughly 79% of searches, followed by Yahoo Japan at about 11% and Bing at nearly 9%.
On desktops in Japan, Bing’s share rises to around 18%.
In South Korea, Google now holds close to 50% of the market, with Naver following at around 41%.
On mobile in South Korea, Naver leads slightly above 56%, with Google close behind.
In Russia, Yandex remains dominant with about 68% of all searches, while Google captures roughly 30%.
Also consider: 60+ SEO ROI Statistics

On mobile in Russia, Yandex keeps around two-thirds of the market share.
In China, Baidu holds about 63%, Bing has grown to around 18%, and Google’s share is below 2%.
Mobile in China remains largely Baidu-driven, with over half of searches happening on its mobile platform.
Google’s worldwide dominance still hovers between 89–91% despite new AI search products entering the market.
In the UK, regulators continue to note Google’s stronghold of over 90% of all search traffic.
In Latin America, Google’s share generally ranges between 90% and 96%, depending on the country.
Across the Middle East and North Africa, Google averages around 93% of the total market.
In Southeast Asia, Google often maintains between 93% and 98%, with local engines appearing in a few countries.
Vietnam occasionally sees spikes in the use of Cốc Cốc on desktop, though Google still leads overall.
In Sub-Saharan Africa, Google dominates mobile search with more than 95% share.
Bing’s highest growth regions in 2025 include the United States, Japan, and Western Europe.
Despite regional competition, Google still processes more than nine out of every ten searches worldwide.
Also consider: 120+ SEO vs. PPC Statistics

About 71% of small businesses invest in SEO at least once a year, up from 64% two years ago.
Roughly half of all small business owners say SEO is their main driver of online leads, beating social media and paid ads.
37% of small businesses outsource SEO fully to agencies or freelancers rather than handling it in-house.
Among companies with fewer than 10 employees, only one in four tracks SEO ROI accurately.
Around 62% of mid-sized companies (50–250 employees) have an internal SEO team or a dedicated specialist.
For larger enterprises, over 80% run hybrid SEO setups, mixing in-house teams with external partners.
SaaS and tech companies spend nearly 2.5x more on SEO compared to traditional service businesses of the same size.
Among B2B firms, SEO accounts for roughly 44% of all digital leads, making it their top inbound source.
E-commerce brands allocate on average 18–22% of their digital marketing budget to SEO.
In B2C industries, product-focused brands are twice as likely to invest in content and link-building as service-based ones.
Local businesses spend an average of $1,000–$2,500 per month on local SEO management and citation work.
Agencies that serve small businesses report SEO as their most requested service; more than PPC or design combined.
Startups under 3 years old see SEO as the most cost-efficient channel, with 65% naming it their long-term focus.
Enterprises with $10M+ annual revenue spend 5–7% of their marketing budgets specifically on SEO operations.
Healthcare companies and law firms remain among the highest-paying SEO clients due to heavy local and compliance-driven competition.
Franchise businesses spend about 25% more on local SEO than standalone local stores.
Also consider: How Long Does SEO Take? 100+ Statistics

B2B SaaS companies often dedicate 30–40% of SEO effort to content strategy alone.
Across large organizations, over 60% of SEO tasks are now supported by automation or AI-driven tools.
Manufacturing and industrial companies saw a 27% rise in SEO investment in 2024 as traditional sales moved online.
E-commerce retailers with over 10K SKUs report SEO as their highest ROI channel, beating ads by nearly 40%.
Non-profit organizations that actively invest in SEO typically receive 3–5x more website visits than those that don’t.
Among service-based companies, SEO drives nearly 52% of all organic conversions across their sites.
Freelancers and solopreneurs make up about 12% of total SEO service buyers, mostly for content and technical audits.
Enterprise websites with over 10,000 pages rely on SEO for nearly 60% of their total traffic.
Agencies with internal SEO teams outperform outsourced setups by an average of 18% in organic visibility.
Retail and hospitality companies increased SEO spending by roughly 30% since 2023 due to decreasing ad ROI.
Real estate firms continue to depend heavily on SEO, with nearly 70% of leads originating from organic traffic.
Among startups, SEO tool adoption jumped 42% year-over-year, with Ahrefs and Semrush being the most common.
Professional services firms (like accounting or consulting) saw a 21% rise in SEO-driven inquiries in the last year.
Overall, small and mid-sized businesses now represent nearly 65% of the global SEO market demand in 2025.
Also consider: 100+ SEO Jobs Statistic

The average monthly SEO budget in 2025 sits between $1,500 and $5,000, depending on company size and industry.
Around 29% of businesses plan to increase their SEO budgets this year, while only 8% expect to reduce spending.
Enterprise brands typically allocate 6–10% of total marketing budgets to SEO, compared to 3–5% for small businesses.
Local SEO budgets average around $800 to $2,000 per month, often split between citations, content, and backlinks.
The global SEO industry is expected to surpass $100 billion in annual spend by the end of 2025.
Content creation and link-building now consume more than 60% of total SEO budgets for most mid-sized agencies.
B2B companies spend about 18% more on SEO than B2C brands due to longer sales cycles and competitive search terms.
E-commerce brands increased their SEO investment by roughly 32% in 2024, following rising ad costs on Google and Meta.
About 41% of marketers report that SEO delivers the highest ROI among all digital marketing channels.
Companies spending over $5,000 per month on SEO are twice as likely to see measurable ranking improvements within six months.
Also consider: 100+ SEO Tools Usage Statistics
Freelancers and small agencies typically charge between $100 and $200 per hour for specialized SEO tasks in 2025.
Monthly SEO retainers remain the most common payment model, used by nearly 72% of SEO providers worldwide.
Performance-based SEO pricing is slowly rising, representing 9% of all agency contracts in 2025.
AI tools and automation platforms now make up 10–15% of total SEO budgets, up from 5% in 2023.
Businesses spending over $10,000 monthly often dedicate an internal analyst purely to monitor SEO KPIs and ROI.
Startups with smaller teams often invest 20–30% of their total marketing budgets into SEO in their first year.
Link-building costs have risen nearly 40% since 2022, driven by stricter editorial standards and premium site pricing.
Content production costs increased by around 25% year-over-year, as brands shift to more authoritative, research-based articles.
Technical SEO audits typically cost between $1,000 and $3,000, depending on site complexity and size.
The average annual SEO contract for enterprise clients now ranges between $50,000 and $150,000.
Agencies serving SaaS and fintech allocate a larger share of budgets to content and digital PR than to on-page work.
In-house SEO teams in large organizations spend nearly 60% of their resources on maintaining and optimizing existing content.
The average cost per quality backlink in 2025 is estimated at $250–$400, depending on the industry.
Around 43% of companies now combine SEO with AI-driven content or automation systems to cut production costs.
Video SEO budgets increased by nearly 20% this year, reflecting the growth of YouTube and TikTok search optimization.
Small business owners report SEO as the most cost-effective long-term channel, outperforming paid ads by roughly 2.8x in ROI.
Healthcare, legal, and finance remain the top three industries with the highest SEO retainers due to competitive regulations.
Global SEO spending growth is projected at 11% annually through 2027, driven by AI search and user-intent optimization.
Agencies offering bundled SEO + PR services have seen an average 22% revenue lift compared to standalone SEO offers.
Despite rising costs, SEO remains the most scalable channel, with over 68% of marketers calling it their “best long-term investment.”
Also consider: LLM Impact on Google Search: 80+ Statistics

WordPress still dominates the web, powering around 43% of all websites, and remains the most SEO-friendly CMS by adoption rate.
About 64% of SEO professionals say WordPress offers the easiest technical optimization options compared to other CMS platforms.
Shopify now powers roughly 10% of all eCommerce sites, with 7 out of 10 Shopify users actively investing in SEO each month.
Wix has improved significantly in SEO performance – 40% of Wix websites now meet Google’s Core Web Vitals benchmarks, up from 25% in 2023.
Squarespace holds about 3% of the total CMS market share, with 58% of its users depending primarily on SEO for lead generation.
Webflow continues to grow among startups and SaaS brands, with SEO adoption increasing by 47% year-over-year.
Around 22% of agencies say Webflow provides better control over technical SEO than traditional drag-and-drop builders.
Magento (Adobe Commerce) remains popular for large-scale retail, though only half of its users regularly update SEO configurations.
WooCommerce, as part of WordPress, is used by over 6 million stores, making it the top platform for SEO-driven eCommerce growth.
Shopify Plus stores typically spend 35–40% more on SEO than standard Shopify merchants due to global and multilingual targeting.
Custom-built CMS platforms represent roughly 12% of SEO-managed websites, often requiring higher budgets for technical fixes.
Drupal maintains strong visibility in government and educational websites, with about 70% of Drupal sites investing in SEO audits yearly.
HubSpot CMS users report 30% higher lead conversion rates when combining built-in analytics with SEO content optimization.
Ghost, the lightweight blogging CMS, has grown steadily; over 25% of its sites now reach 10K+ monthly organic visits.
Headless CMS setups are gaining traction, used by 18% of enterprise websites for faster page loads and API flexibility.
Next.js and Gatsby-based sites show an average 15% faster indexing rate when properly configured with SSR (server-side rendering).
Squarespace and Wix users spend about 25% less on SEO services than WordPress users, but typically see slower ranking gains.
Webflow users outperform Wix users in organic traffic growth by nearly 2x, based on 2025 trend reports.
E-commerce SEO on Shopify and WooCommerce now makes up over 40% of the total SEO service demand across agencies.
CMS migration-related SEO projects increased by 28% in 2024, with most moves happening from Wix and Squarespace to WordPress or Webflow.
AI-generated CMS integrations (like Wix ADI and WordPress AI plugins) now handle about 15% of content optimizations automatically.
Webflow’s share in enterprise SEO has doubled in the past 18 months, driven by startups needing flexibility without heavy plugins.
Headless WordPress configurations grew by 22% year-over-year, showing a clear move toward API-based SEO scalability.
Among SaaS and tech companies, Webflow powers roughly 1 in 5 new websites launched in 2025.
WordPress websites with SEO plugins like Rank Math or Yoast average 35% higher on-page scores than those without them.
Wix’s blog feature now contributes nearly 30% of total organic traffic for its business users, a notable shift since 2022.
Shopify merchants that blog monthly experience 55% more organic visits than those who don’t publish content at all.
Enterprises using headless CMS report an average 18% improvement in site speed, which directly supports stronger Core Web Vitals.
WordPress, Shopify, and Webflow combined account for nearly 70% of SEO agency clients worldwide in 2025.
Despite new AI and headless technologies, WordPress remains the gold standard for SEO flexibility and control across all industries.
After digging through countless reports, data sources, and platform analytics, one thing became clear: the SEO market is more competitive and fragmented than ever. A few key players still hold massive influence, but smaller, specialized tools and agencies are steadily gaining ground by offering precision and innovation where the giants can’t.
What stood out most in my research is how quickly the market shifts when AI integrations or search updates roll out. If you’re in the SEO space, whether as a business owner, freelancer, or agency, understanding these shifts isn’t optional anymore. It’s what determines who stays relevant and who fades away.
Use these insights to see where the industry is heading, and position yourself on the winning side of that change.